From StonQL to Natural Language
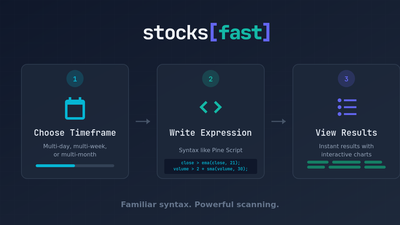
I created StonQL as a tool exclusively designed to scan the stock market. My elevator pitch was "Pine Script but for scanning". By my own measures, I succeeded. I'm quite happy with the result.
But I'm a career software engineer. What may feel simple, trivial, and straight-forward to me might feel like trying to read and write Greek to others. What if my judgement of a language's simplicity is not to be trusted? What if I could simplify scanning even further than it already is? Why should users need to know a language's syntax rules to get their desired results?
The point is this: no matter how simple and expressive I made the syntax feel, it is still special syntax and technically still coding. And going from trader to coder is not a leap many may want to make.
That's where AI comes in.
Drinking the AI Kool-Aid?
Have I joined the Cult of AI? Nevermind my flashy new hooded robes and lifetime supply of Kool-Aid. Yes, I know every piece of software is "AI-Powered" these days. Hell, your mom's Aunt Beatrice probably has integrated AI into her vertical Saas startup by now.
I created the building blocks. I've abstracted a way to generate high-performance queries, the data pipeline, the API, into a simple-to-use and very finite language.
This, I believe, is a prime candidate for enhancement with AI that's actually useful. Why? Because it bridges the gap between natural language and specialized syntax. It's actually the perfect tool to get ideas out of your head and into a scan.
Think about it. You know how to describe patterns you might be looking for. You know how to say "I want to see undercut and reclaim of the prior month low" or "I want only stocks that pierced a rising 8EMA (at least 5 bars rising) and 8EMA above 21EMA, 55EMA, 233 EMA".
Now that I've hooked up an LLM, you can tell it exactly that and it knows what to do. Now, you don't even need to learn our language to be an effective market scanner!
Real Examples
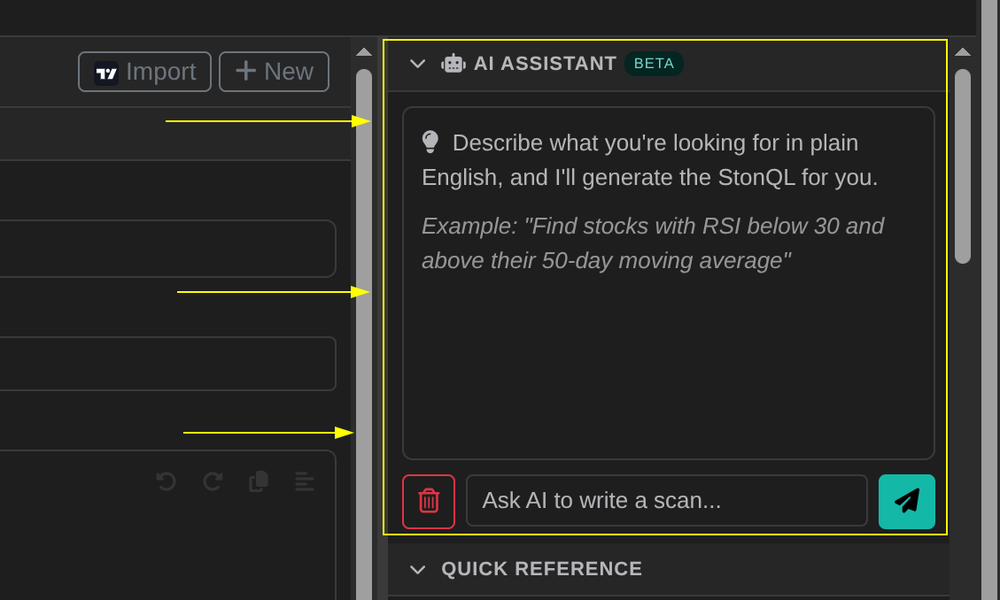
With our new integrated chat window, you can prompt our AI Assistant with what you're looking for, and it will generate valid StonQL for you to scan. Let's see what it's capable of.
These examples are all unfiltered, undoctored, one-shot examples of our AI assistant in action.
EMA Pierce with stacked EMAs
Show me stocks that pierced a rising 8EMA, with 8EMA above 21EMA and 21EMA above 55EMA
// EMA relationships
ma8 = ema(close, 8);
ma21 = ema(close, 21);
ma55 = ema(close, 55);

// 8 EMA must be rising
ma8 > ma8[1];

// EMA hierarchy: 8 > 21 > 55
ma8 > ma21;
ma21 > ma55;

// Price pierced 8 EMA (low touched or went below, but closed above)
low < ma8;
close > ma8;

// Optional filters for quality
close > 10;  // Avoid very low-priced stocks
volume > sma(volume, 50);  // Liquidity confirmation
The AI just knows what you want. It knows what you meant by "pierced the 8 EMA". It correctly compares the moving averages you specified.
Mean Reversion with Bollinger Bands
Show me stocks that are relatively flat over the last 20 bars, pierced the upper bollinger band, but closed red
// Measure flatness using standard deviation of close prices
stdev_close = stdev(close, 20);

// Relatively flat: low standard deviation (less than 3% of price)
stdev_close < close * 0.03;

// Pierced upper Bollinger Band
high > bb_upper(close, 20, 2);

// Closed red (bearish candle)
close < open;

// Optional quality filters
close > 10;
volume > sma(volume, 50);
This example does what even I wouldn't have thought of: Using the stdev function as a way of measuring performance over a relative period.
Break and Reclaim Pivot
stocks that pierced last month's low but closed green
// Get last month's low (actual monthly candle)
monthly_low = mtf("1M") {
    low[1];  // Use previous month's low to avoid current month
};

// Daily low pierced last month's low
low < monthly_low;

// Closed green (bullish)
close > open;

// Quality filters
close > 5;  // Avoid penny stocks
volume > sma(volume, 20);  // Above average volume
turnover > 10M;  // Ensure meaningful liquidity
This result even knows how to use our powerful mtf blocks to properly scan multiple timeframes. It's smart enough to know "hey, the user asked for last month's low" so it extracted the prior month candle specifically! Impressive.
Monthly Floor Trader Pivot Support Pierce and Reclaim
How about stocks that pierced monthly floor trader pivot S1 and closed green
// Calculate monthly pivot points
monthly_high = mtf("1M") { high; };
monthly_low = mtf("1M") { low; };
monthly_close = mtf("1M") { close; };

// Floor Trader Pivot Point Calculation
pivot = (monthly_high + monthly_low + monthly_close) / 3;
s1 = pivot * 2 - monthly_high;

// Pierced monthly S1
low < s1;

// Closed green
close > open;

// Additional quality filters
close > 10;
volume > sma(volume, 20);
turnover > 10M;
I didn't even have to train it to know what a floor trader pivot is. Funny thing is, supporting a floor trader pivot indicator was on my todo list. Now, I wonder if it should be? What if the building blocks are enough to compose more elaborate scans?
That's the power of generative AI. It's creating more ways to use the tools I provided it.
Lowering the Barrier to Entry
What this means for you is that the barrier to entering the stock scanning promised land is effectively ZERO.
You don't even need to know our [awesome] scanning language rules, syntax, or available functions. We've fed all of that into the AI assistant. You can just tell it what you're looking for, and it will come up with a scan for you.
I'm not going to sit here and tell you that it will always be correct, or that it perfectly captures your ideas every time. Of course not. It will make mistakes. That's unavoidable with LLMs. We're still refining, working out bugs. It might even generate StonQL that exposes bugs in the compiler.
But what I am saying is that it's easier than ever to start fleshing out an idea from your head onto the screen and into scans.
Where to Find It
You'll find the integrated chat window on the right-hand sidebar on the scanner page. Just start typing in the chat box to get started!
What's Next?
What's exciting to me is that I don't know what will be possible. What kind of scans can it come up with, fed by you the trader, using your unique market insights?
So give it a try. Chat with the new assistant. Refine your results. Iterate. I hope it helps you get the results you seek faster!