Find exactly the setup you're looking for.
| Symbol | Name | Close | Change | $ Vol |
|---|---|---|---|---|
| NVDA | NVIDIA Corporation | 142.87 | +3.24% | 12.4B |
| PLTR | Palantir Technologies | 78.52 | +2.18% | 2.1B |
| SMCI | Super Micro Computer | 43.21 | +4.67% | 1.8B |
| ARM | Arm Holdings | 187.34 | +1.92% | 892M |
| ANET | Arista Networks | 412.56 | +2.31% | 654M |
| CRWD | CrowdStrike Holdings | 398.12 | +1.87% | 521M |
| PANW | Palo Alto Networks | 187.89 | +1.54% | 412M |
An AI-powered stock screener that speaks your language.
It's 2026, and you're scanning the market with dropdowns?
Traditional screeners force you into their rigid boxes. Pick an indicator. Pick a comparison. Pick a value. Repeat. Hope it's enough.
Meanwhile, the setups you actually trade — the ones you see on the chart — can't be expressed in dropdown menus. So you scan for something close, then manually filter hundreds of results.
StocksFast lets you describe exactly what you're looking for, in precise language that describes the condition you're searching for.
rsi(close, 14) > 50;
ema(close, 8) > ema(close, 21);
close > high[1];
close > sma(close, 200);
close > sma(close, 200);
close > 20;
volume > 2 * sma(volume, 20);
close > sma(close, 200);
close > 20;
volume > 2 * sma(volume, 20);
rsi(close, 14) > 50;
close > open;
No syntax to learn.
Just describe what you want.
Start with an idea. Refine it through conversation. The AI builds your scan iteratively — adding filters, adjusting thresholds, combining conditions — until it matches exactly what you're looking for.
You describe the setup. AI handles the syntax.
ta.ema(close, 21)
ema(close, 21)
close[1]
close[1]
ta.crossover(a, b)
crossover(a, b)
ta.rsi(close, 14)
rsi(close, 14)
cond1 and cond2
cond1 and cond2
high > high[1]
high > high[1]
Already know Pine Script?
You'll feel right at home.
StonQL borrows the best ideas from Pine Script — historical references, built-in indicators, readable boolean logic. If you've written Pine, you already know 90% of the syntax.
The difference? StonQL is purpose-built for scanning, not charting. No plotting functions. No strategy blocks. Just pure filter logic that runs against thousands of stocks in milliseconds.
Same mental model. Laser-focused purpose.
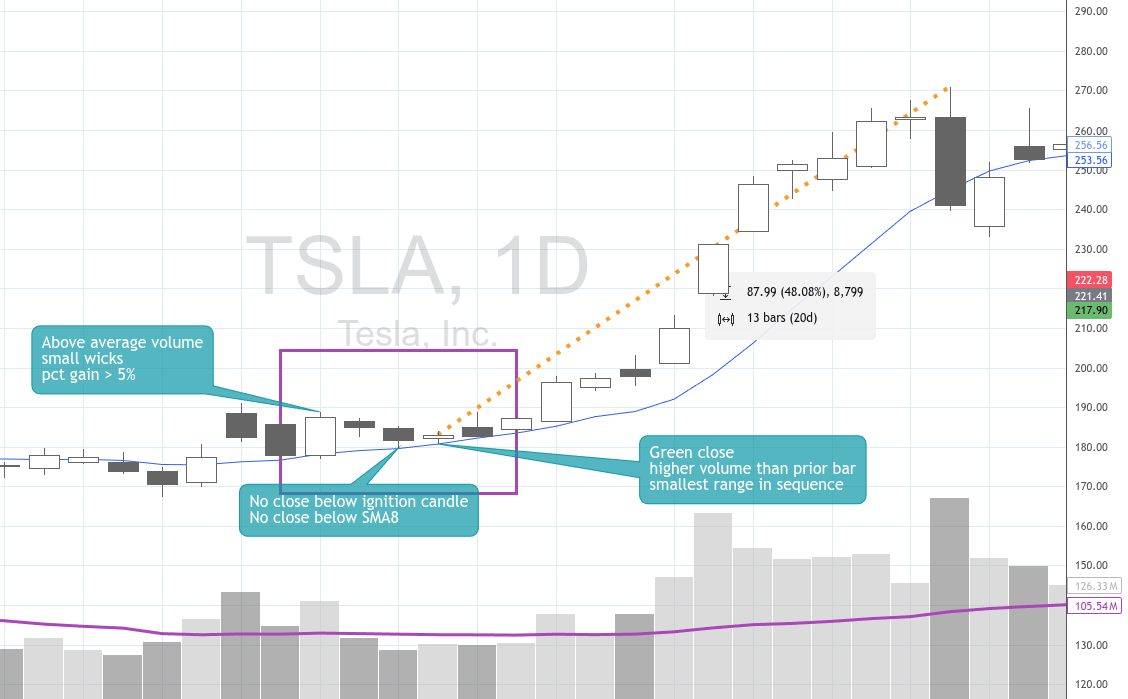
You See the Setup. Now Scan for It.
This is a real chart pattern. We described it to the AI and refined it through conversation until it matched exactly what we were looking for.
"Show me stocks that made an ignition bar with very small wicks with higher than average volume. Followed by two red bars on lower volume that don't break the ignition bar's range. The last bar must be an inside bar with the smallest range."
// Ignition Bar: Strong green bar with very small wicks
close[3] > open[3];
(high[3] - close[3]) < (high[3] - low[3]) * 0.1;
(open[3] - low[3]) < (high[3] - low[3]) * 0.1;

// Higher than average volume on ignition bar
volume[3] > sma(volume, 20) * 1.5;

// Next two bars are red with lower volume
close[2] < open[2];
close[1] < open[1];
volume[2] < volume[3];
volume[1] < volume[3];

// Follow-up bars don't break ignition bar's range
high[2] <= high[3];
low[2] >= low[3];
high[1] <= high[3];
low[1] >= low[3];

// Last bar is an inside bar with smallest range
high <= high[1];
low >= low[1];
(high - low) < (high[1] - low[1]);
(high - low) < (high[2] - low[2]);
(high - low) < (high[3] - low[3]);
Generated through iterative conversation with AI

One Language. Every Timeframe.
Daily. Weekly. Monthly. Quarterly. Even exotic periods like 2D, 3D, or 4W. Write once, scan anywhere.
Build your universe on higher timeframes — filter for stocks in long-term uptrends on the monthly chart. Then drop down and trigger entries on daily setups. Same syntax, different lens.
Multi-timeframe analysis without the mental gymnastics.


Filter by Higher Timeframes.
Add conditions from any higher timeframe directly in your scan. Require the weekly candle to be green. Demand the monthly trend be up. Stack as many timeframe filters as you need.
No more eyeballing charts to check if the bigger picture aligns. Let the scanner enforce your rules automatically.
Higher timeframe confirmation, built in.
Compare Across Timeframes.
Pull values from higher timeframes and compare them directly to your current timeframe. Did the daily close reclaim the weekly 8 EMA? Is price trading above last month's high?
Extract any indicator or price level from any timeframe and use it as a reference point. This is cross-timeframe analysis that other screeners simply can't do.
The most powerful feature you've never seen.


Watchlists That Work With You
Watchlists aren't an afterthought — they're central to how StocksFast works.
- →Import/export with TradingView and other platforms
- →Limit scans to your universe — skip the noise
- →Add matches directly to watchlists from scan results
- →Cull stocks you've reviewed to keep lists tight
Fully Composable Manual Scanning.
Results stay selected. Your next scan targets only them.
Run any scan. Your matches become selected stocks. Check or uncheck individual tickers. Switch timeframes, load a different saved scan, run it—only your selection is tested.
No mega-expressions. Just simple, focused scans you can chain in any order with your judgment at every step.
Build a library of single-purpose scans. Combine them however the market demands.
50+ Ready-to-Use Scans
Explore expressions across popular trading strategies. Copy, tweak, make them yours.
A question worth asking.
"What would my results look like if I never missed an entry?"
"What if I never missed an exit signal?"
We can't trade for you. But we can make sure you see every opportunity that matches your criteria.
Ready to stop missing setups?
No credit card required