What is Stocksfast? I built StocksFast because existing screeners couldn't handle how I trade. I run position trades across weekly, monthly, and quarterly timeframes. I need to know when a 12-month uptrend prints a new bar, which 3-week setups are showing continuation, and which daily charts are triggering entries. Manually tracking hundreds of stocks across multiple timeframes meant I'd miss setups or forget to review charts until it was too late.
What It Does
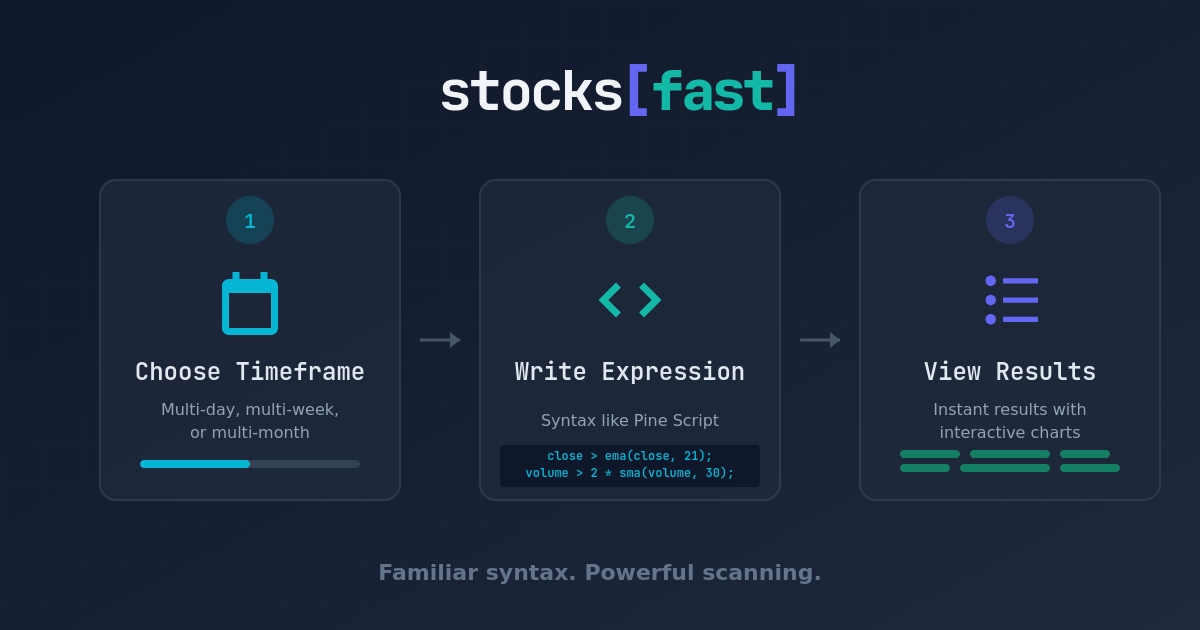
StocksFast is a technical stock scanner with a programmable DSL. You write expressions describing exactly what you want, and it finds matching stocks across 5,000+ US equities. Think Pine Script, but built for screening instead of charting.
Example:
x = ema(close, 8);
high > high[1] and close > x;
rsi(close, 14) > 50;
This scans the entire market in under 0.1 seconds and returns only stocks matching all three conditions.
Multi-Timeframe Workflows
The tool supports 15 aggregated timeframes (aka candle period): 1D through 5D, 1W through 4W, and 1M through 12M. You can build scan workflows that mirror how you actually trade:
Scan
12M Scan
12M: close > high[1]; → 452 stocks in-force up
- Save results to watchlist
- Scan that watchlist on 1W: Rising 8-EMA pierce → 37 stocks
- Scan those 37 on 1D: Inside bar or hammer → 8 final candidates
Most screeners force you to start from scratch each time. StocksFast lets you save results, remove reviewed stocks, and progressively narrow your universe across timeframes.
Indicators and Syntax
The DSL includes 30+ technical indicators: moving averages (SMA, EMA, WMA, HMA), momentum (RSI, Stochastic, Williams %R), trend (MACD components, Aroon, CCI), volatility (ATR, Bollinger Bands), and pattern functions (crossover, rising, falling, highest, lowest).
You can reference historical values (close[5]), access indicator properties (macd().signal), and build complex multi-condition expressions. The system translates everything to optimized queries that run in under 100ms.
Who It's For
You'll find this useful if you:
- Run systematic strategies with specific entry/exit criteria
- Trade across multiple timeframes (not just daily charts)
- Manage 10-50 positions simultaneously
- Think in code rather than clicking through dropdown menus
- Want to automate the repetitive parts of chart review
It's less useful if you trade purely on discretion, focus on fundamentals, or only need simple single-timeframe scans.
Pricing and Availability
$49.97/month with a 30-day money-back guarantee. That's about $1.67 per day—cheaper than missing one good entry or holding a losing position too long.
The platform is live at stocksfast.io. You can browse 70+ example scans organized by strategy (The Strat, MACD, RSI, momentum, breakout, reversal), save unlimited custom scans with tags, and build as many watchlists as you need.
What Makes It Different
Unlike TradingView (built for charting, not screening) or Finviz (limited to dropdown menus), StocksFast is purpose-built for multi-timeframe scan workflows. You can express complex criteria in readable code, chain scans across timeframes, and progressively filter large universes down to high-conviction setups.
Next Steps
If this sounds like what you've been looking for, check out the Scanner and give it a try. The 30-day guarantee means you can test it on your actual strategies without risk.
I built this because I needed it. If you trade like I do, you probably need it too.